![]()
Weekly Update, Spike in Volatility
Time for a quick recap of some important events from last week. Some data obtained from our friends at the Sherman Sheet and used with their permission.
U.S. Markets: Stocks finished the week on a down note as volatility returned to the market, with both domestic and global conflicts contributing. On Monday, the S&P 500 index recorded its biggest one-day gain in almost four months, but gave it all back on Thursday when it fell the most in three months. The Dow Jones Industrial Average registered its second down week, falling -183 points to close at 21,674, a decline of -0.8%. The tech-heavy Nasdaq Composite recorded its fourth consecutive week of losses, losing another 40 points to end the week at 6,216, a loss of -0.6%. By market cap, smaller cap indexes again fared worse than large cap. The large cap S&P 500 index fell -0.65%, while the mid cap S&P 400 and small cap Russell 2000 indexes lost -1.1% and -1.2%, respectively.
Many analysts have been calling for a top and a cool-off in US markets. This could be a tremor trigger of worse things to come. However, as I write this on Tuesday morning the major US indexes are all higher again, and volatility is falling back to normal.
Homebuilders Theme Update: Sentiment among the nation’s home builders rose this month after falling to an 8-month low last month, according to the National Association of Home Builders (NAHB). The NAHB’s builder sentiment index jumped four points to a reading of 68, exceeding economists’ forecasts by three points. Every component of the index rose in August. Current conditions gained four points to 74, conditions expected over the coming six months rose five points to 78, and the index of buyer traffic added a point to 49. Builder sentiment had surged following the U.S. Presidential election in which then-candidate Donald Trump promised to roll back regulations and lower builder costs, but the index has lost some ground since then. In the latest release, the NAHB attributed the increase to “ongoing job and economic growth, attractive mortgage rates, and growing confidence.” Builders continued to be concerned with lot and labor shortages and the risings costs of building materials.
The number of new homes being built rose in June, but the rate at which builders broke ground slowed. Housing starts ran at a 1.16 million seasonally-adjusted annual rate in July, according to the Commerce Department. That’s a drop of 4.8% from June’s pace and 5.6% lower than the same time last year. Economists’ had expected a 1.23 million rate. Housing permits, a gauge of future building activity also fell, sliding 4.1% compared to June’s pace. Analysts were quick to point out that the government’s new-home data is volatile and often heavily revised in later months. In the details of the report, one sign of a stabilizing housing market was the number of single-family starts. That number was at an 856,000 rate, similar to June’s reading. One year ago they were at a 772,000 annual rate. The increased emphasis on single-family homes, rather than apartments, is a sign that builders believe the economy can support more homeownership—not just rentals.
This is interesting and good news for our sector position in the Homebuilders space that we have been following since early this year.
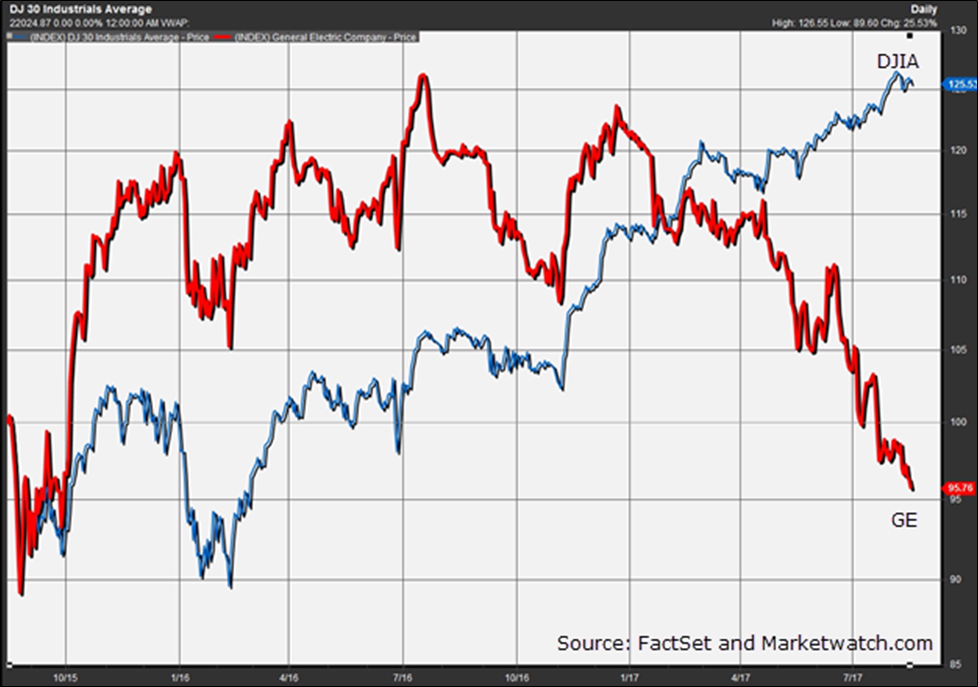
I found this little tid-bit interesting and worthy of sharing as well: Legendary stock market technician Tom McClellan released a note this week on the subject of the historical relationship between the stock price of General Electric and the U.S. equity markets as a whole, and the news wasn’t good.
Historically, the price of General Electric and a broader U.S. benchmark such as the Dow Jones Industrial Average have moved in lock-step with each other as shown in the graphic below. Up until this spring, the two had followed that general historical relationship. Since then, however, GE has underperformed quite significantly.
Why is this concerning? Because according to McClellan, “The basic idea is that when the DJIA and such a major component as GE disagree, it is usually GE that ends up being right about where both are headed.”
Foreshadowing, or is it “different” this time? Stay tuned for more…
(The chart below, from FactSet and Marketwatch.com, shows the dramatic divergence.)
I hope you all have a great week. Keep enjoying summer and make the most of this wonderful weather as we shift into “back-to-school” mode and football season!