![]()
The second quarter is coming to a close...
Well, the year is almost halfway over! Time truly flies when you are having fun. We have many new happenings in the office this summer--including the occasional visit from my new hunting dog, Stella (you can see pictures of her on my Twitter and Facebook pages). Time to get down to business and let you know what has been going on...
The data and information below come from a research firm I subscribe to called the Sherman Sheet. Their information is timely and accurate and I think you will find it a very detailed and informative update on the markets. Some chart and market data also comes from Asubry Research in Chicago.
In the market:
The major U.S. benchmarks all recorded losses for the week, with the smaller cap indexes bearing the brunt of the selling. The Dow Jones Industrial Average fell 190 points to close at 17,675, down -1.06%. The tech heavy NASDAQ composite gave up 94 points to close at 4,800, down -1.92%. The S&P 500 Large Cap index declined -1.19%, while the S&P 400 Mid Cap index and the Russell 2000 Small Cap index ended down -1.28% and -1.65%, respectively. The defensive Dow Jones Utilities index gained +0.88%, and the Dow Jones Transports index fell -2.25%.
On the flip side, precious metals enjoyed their third week of gains as gold climbed +$25.30 to close at $1,301.60 an ounce, up +1.98%. Silver rose +$0.19, ending the week at $17.52 an ounce, up 1.10%. The industrial metal copper regained some of last week’s plunge, rising +1.33%. Copper’s futures data suggests that traders in that market expect copper to be bullish long-term. The price of copper has continued downward since early 2012. This is one precious metal that we are watching closely for a bottom, and may consider adding to our model mix in the near future.
The news is filled with speculation on the outcome of the Brexit vote - the Bank of England has issued a fresh warning that a vote to leave the EU in this week’s referendum risks impeding economic growth, forcing the pound lower, and sending shock waves through the global economy. We all anxiously await the impact of the vote. Expect to hear much about it on Thursday of this week.
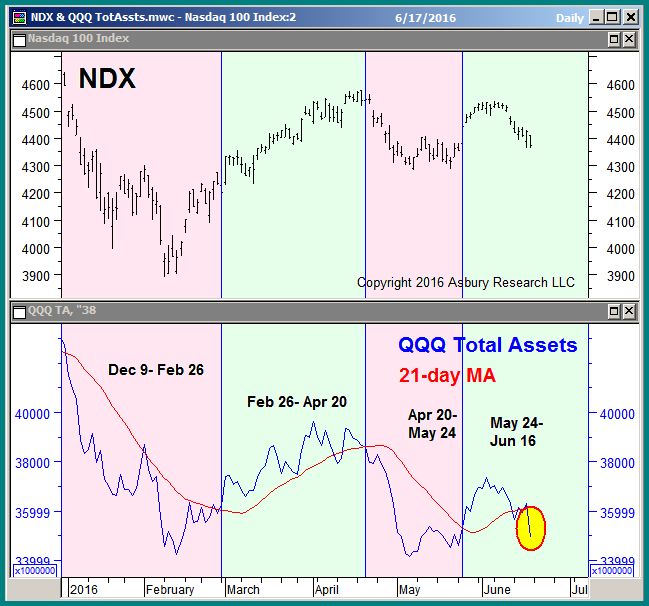
Recently, I released a video that discussed three market components that I follow closely Watch Video. The PowerShares QQQ ETF appears to be turning near term bearish based on a key indicator - asset flows. The highlighted circle in the lower right edge of Chart 2 below points out that the total net assets invested in QQQ collapsed below their 21-day moving average on Friday, indicating investors were unwilling to carry long positions over the weekend and warning that a new trend of monthly contraction may be beginning, perhaps similar to the ones that triggered and fueled the December-February and April-May declines in the NASDAQ 100 (NDX, upper panel). Chart courtesy of Asbury Research.
IN SUMMARY - Last Friday my Long Term Growth composite for Alternative Strategies Group clients was over 60% in cash. A good thing for the declining markets we suffered last week. As early as Monday of this week I began taking postions in the Dow Jones Industrial average and the S&P 500 Index. As of Wednesday nights' close of market we are now less than 40% cash. I will continue to watch and monitor as the story unfolds. Have a great weekend everyone!
Material discussed is meant for general illustration and/or informational purposes only and it is not to be construed as investment, tax or legal advice. Although the information has been gathered from sources believed to be reliable, please note that individual situations can vary. Therefore, the information should be relied upon when coordinated with individual professional advice.
The NASDAQ 100 Index is an unmanaged index of 100 of the largest domestic and international non-financial companies listed on The Nasdaq Stock Market based on market capitalization.