![]()
Thoughts on the Current Market Situation
The Week Ahead:
We have had a nice run since the Brexit event in late June. All the major US market indexes have produced positive returns, some even hitting all-time highs. However, last week I started to see some indication of a topping in the major indexes, suggesting we might be in for a days to weeks pullback of sorts before we start to make new highs again.
Some comments from Asbury Research that better articulate my concerns:
“Although the market didn’t decline last week, it didn’t rally either. Our work continues to indicate that there is more near term downside risk than upside opportunity at this level. In other words, we believe that a better buying opportunity, at lower prices, is likely to emerge over the next few weeks.”
Chart 1, an updated version of that chart, shows that this metric continues to hover at those same least bearish extremes. Meanwhile, the S&P 500 is essentially unchanged from a week ago, up just 13 points from the Friday July 15th close.
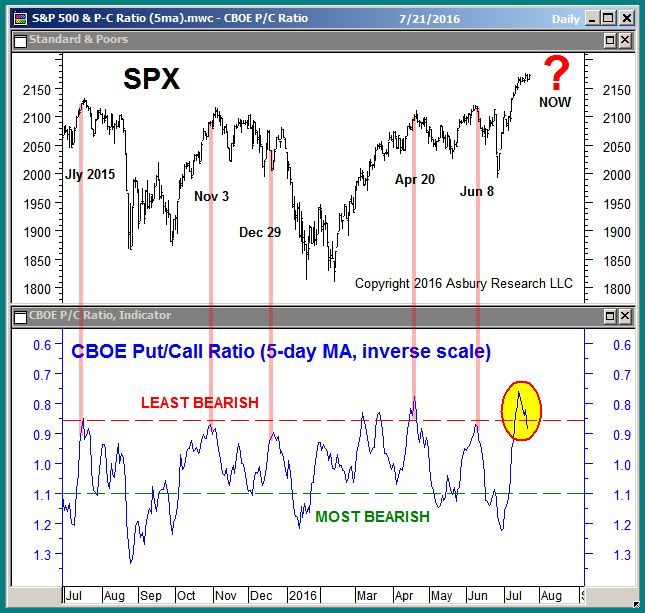
This week as I work on data from several sources I am watching very closely the Put/Call ratio as indicated in the chart above. We may be headed for a short-term pullback in US equities, which I ultimately believe will result in a buying opportunity.
My friends at the Sherman Sheet provide me with a very detailed recap of the markets each weekend. Here are some excerpts from their weekly report below.
In the markets:
Stocks managed a fourth straight week of gains, allowing the S&P 500 LargeCap and the S&P 400 MidCap indexes to claim new record highs. The technology-heavy NASDAQ rallied over 70 points on strong earnings reports from Microsoft and semiconductor firm ASML Holdings. For the week, the Dow Jones Industrial Average gained an additional +54 points to close at 18,570, up +0.29%. All of the major U.S. indices were up as the LargeCap S&P 500 rose +0.61%, the MidCap S&P 400 gained +0.56%, and the SmallCap Russell 2000 added +0.63%. The best-performing U.S. index, the NASDAQ Composite, surged +70 points and closed at 5,100, up +1.4%. Interestingly, defensive plays such as Utilities stocks continue to rally with the broad market—the Dow Jones Utility Average gained 1.45% last week as well.
In commodities, precious metals lost their luster, experiencing a second week of losses. Gold fell -$14.30 to $1323.40 an ounce, down -1.07%. Silver, likewise, fell -$0.61 to $19.69 an ounce. Crude oil fell over -4.5% to $44.19 a barrel for West Texas Intermediate. Commodities as a group continue to be pressured, as the Commodity Research Bureau (CRB) Index fell -3.16% last week.
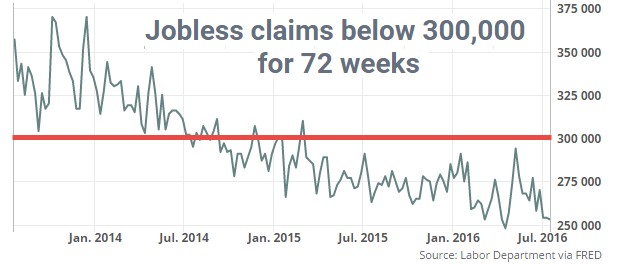
In U.S. economic news, applications for unemployment benefits fell by 1,000 to 253,000 as jobless claims remained below the 300,000-level for the 72nd consecutive week. Forecasts had called for a seasonally-adjusted 260,000 initial jobless claims last week. Claims have now remained below 300,000, a key benchmark, for the longest streak since 1973. The 4-week average of new jobless claims, smoothed to reduce volatility, declined by 1,250 to 257,750 according to the Labor Department. Continuing jobless claims, which counts those already receiving benefits, declined by 25,000 to 2.13 million in the week ended July 9th.
Sentiment among U.S. home-builders diminished in July, according to the National Association of Home Builders (NAHB) index which fell 1 point to 59 after 4 months of unchanged readings. Economists had expected the index to remain at 60. Builder confidence peaked at a 10-year high last fall, but has remained in a relatively narrow range since. Builders continue to report difficulty finding lots and labor according to a statement released by the NAHB.
Sales of previously owned homes rose last month to a fresh new high, evidence that the existing-home market continues to be on firm footing. Existing-home sales rose 1.1% to a seasonally adjusted annual rate of 5.57 million in June, according to the National Association of Realtors. Home sales are 3% higher than this time last year and are the strongest since February of 2007.
In Summary:
There are many bullish indications in the overall economy currently. However, as a tactical money manager, I strive to take advantage not only of long-term trends but short-term moves that can work in our favor. Everything that I read is suggesting we are going to have a successful 2016, even with the presidential election in November. However, I fully expect some short-term bumps in the road before we roll into fall.
Material discussed is meant for general illustration and/or informational purposes only and it is not to be construed as investment, tax, or legal advice. Although the information has been gathered from sources believed to be reliable, please note that individual situations can vary. Therefore, the information should be relied upon when coordinated with individual professional advice.